Dynamic thermal modelling of closed loop geothermal heat pump systems
Why dynamic thermal modelling is so vital to Closed Loop Geothermal Heat Pump system design
A ‘traditional’ gas fired boiler and vapour compression chiller based Heating Ventilation and Air Conditioning (HVAC) system design can be sized with a reasonable level of confidence simply by determining the peak heating and cooling load of a given building. This is not the case for Closed Loop Geothermal Heat Pump systems. The heat source and sink for such a system is the rock and earth that surrounds the ground loops. Over the course of a year the ground temperature varies sinusoidally as heat is either rejected into the ground (cooling operation) or abstracted from the ground (heating operation).
The operating efficiency of a heat pump depends largely upon the temperature differential between the source-side entering water temperature from the ground loops and the system-side (Chilled Water (CHW) / Low Temperature Heating Water (LTHW)) water temperature. The smaller the temperature differential, the more efficiently the heat pump will operate. To understand the seasonal efficiency of a Closed Loop Geothermal Heat Pump system it is therefore necessary to be able to simulate the seasonal variation in the ground temperature surrounding the geothermal loops.
Furthermore, it is important that there is a reasonable balance between the total annual heat energy rejected into the ground and that abstracted. A significant imbalance will result in the gradual increase in ground temperature over successive years, in the case of a cooling dominated load profile; or a gradual decrease in temperature, for a heating dominated load profile. An increase in ground temperature over successive years will eventually result in a drop in heat pump cooling efficiency (as the differential between geothermal water and CHW temperature increases) as well as a reduction in heat pump cooling capacity and vice versa for heating operation.
[edit] Closed Loop Geothermal Heat Pump simulation process
[edit] Step 1: Generating annual heating and cooling load profiles
The first step in simulating the performance of an installation is to establish the annual heating and cooling load profiles. Deriving accurate annual heating and cooling load profiles requires the use of sophisticated simulation tools used in conjunction with realistic estimates of dynamic occupancy, lighting and equipment loads.
For peak load analysis, occupancy, lighting and equipment loads are often assumed to be at a constant peak – this is of course highly unrealistic and if used for annual energy analysis, will result in a gross over-estimation of cooling energy consumption and an equal under-estimation in heating.
Engineers should exercise caution in the use of the more basic Dynamic Thermal Modeling (DTM) software that is available on the market. It is also important that the DTM accurately models the HVAC system and controls. The use of generic system templates can result in significant inaccuracies and should be used with caution.
[edit] Step 2: Calculating the abstraction and rejection of heat between the heat pumps and the bore field
Having derived the annual heating and cooling load profiles of the HVAC system, the next stage in the analysis is to calculate the abstraction and rejection of heat from and to the geothermal bore field.
When in heating mode, the heat abstracted from the ground (QAbstraction) is calculated as follows:
When in cooling mode, the heat rejected to the ground (QRejection) is calculated as follows:
The calculation of the heat of abstraction and rejection creates a ‘chicken and egg’ situation as it requires that the operating Coefficient of Performance (COP) of the heat pumps is known. However, the heat pump operating COP can only be determined from knowledge of the geothermal bore field temperature which, in turn, is calculated from rates of heat abstraction and rejection.
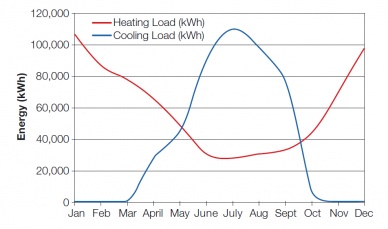
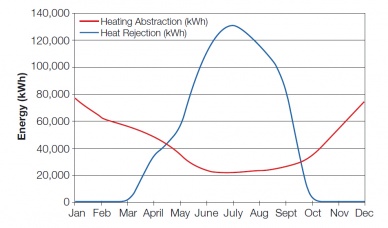
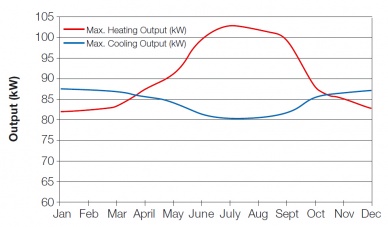
The problem is circular. In order to break this stalemate it is necessary to make an initial estimate of heat pump operating COP. Figure 4 shows the annual heating and cooling load profile displayed in monthly ‘bins’ for clarity. Figure 5 shows the heat of abstraction and rejection.
Figure 4: Annual heating and cooling load profile – monthly data
Figure 5: Annual heat of abstraction/rejection profile – monthly data
It is apparent when comparing the two graphs that the relatively balanced heating and cooling load profiles displayed in Figure 4 actually result in an imbalance in heat exchange with the bore field, with the heat of rejection dominating over the heat of abstraction. This is because the heat emitted by the compressor assists the heat pump when in heating mode, but hampers performance in cooling mode.
[edit] Step 3: Sizing the geothermal bore field
Having calculated the annual heat of abstraction and rejection, the annual variation in the temperature of the geothermal bore field can be determined. The input data required by Closed Loop Geothermal Heat Pump sizing software is broadly similar; requiring the user to define the following:
- Bore field configuration (vertical, horizontal etc)
- Ground temperature properties
- Ground layer description (depth, material properties etc)
- Ground heat exchanger pipe properties
- Geothermal circulation fluid properties (ethylene/propylene glycol etc)
- Heat pump details (peak capacity, COP etc)
- Abstraction/rejection heat loads.
There are no hard and fast rules that govern the sizing of a geothermal bore field, although heat pump manufacturers recommend that bore field leaving water temperature should not be allowed to stray outside a minimum of 5°C and a maximum of 32°C.
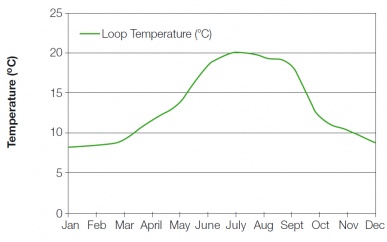
For the annual abstraction and rejection heat loads displayed in Figure 5, and with minimum and maximum leaving water sizing limits of 8°C and 30°C respectively, an annual leaving water temperature profile was calculated as shown in Figure 6 and a required borehole length of 9097m (72 bores, each 128m deep).
Figure 6: Annual geothermal bore field leaving water temperature profile
[edit] Step 4: Establishing heat pump COP and peak capacity
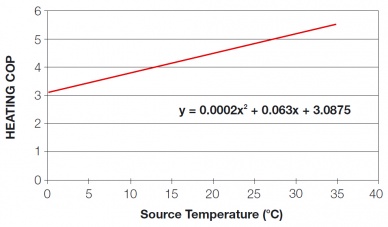
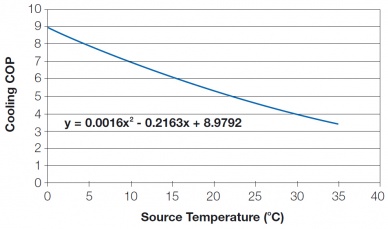
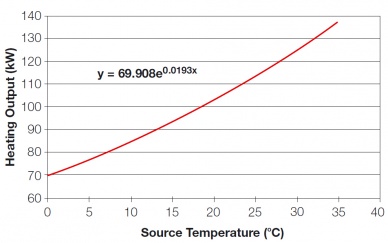
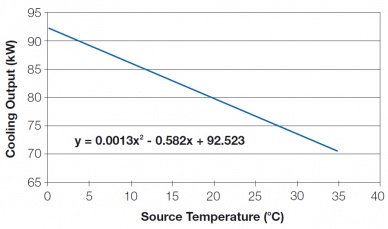
Having established the annual geothermal bore field leaving water temperature profile, it is possible to determine the annual variation in heat pump operating COP as well as the variation in peak heat and cooling capacity. Figures 7 and 8 show the relationship between entering geothermal water temperature (source temperature) and COP. Figures 9 and 10 show the relationship between entering geothermal water temperature and peak heating/cooling capacity.
Figure 7 Relationship between heating COP and entering source water temperature
Figure 8 Relationship between cooling COP and entering source water temperature
Figure 9 Relationship between heating capacity and entering source water temperature
Figure 10 Relationship between cooling capacity and entering source water temperature
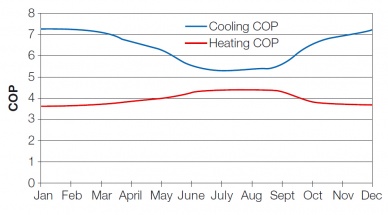
Figure 11 Annual variation in heat pump COP – monthly data
Figure 12 Annual variation in peak heating and cooling capacity – monthly data
Using the expressions given in Figures 7 and 8 in conjunction with the annual bore field leaving water temperature profile given in Figure 6, it is now possible to derive the annual variation in heating and cooling COP as shown in Figure 11.
Using the expressions given in Figures 9 and 10 in conjunction with the annual bore field leaving water temperature profile also allows us to derive the annual variation in peak heating and cooling capacity of an individual heat pump as shown in Figure 12. This allows us to determine the maximum number of heat pumps required and how the number of on-line heat pumps varies over time – a key factor in determining the parasitic pump power associated with the system.
In Step 2 of the analysis methodology, the necessity of estimating initial COP values was discussed. Having completed the first iteration of the analysis and derived a complete annual variation in COP (Figure 11), these values should now be plugged back into Step 2 of the analysis in order to obtain more accurate heat of abstraction and rejection figures. This iterative procedure should be repeated until the COP values entered in Step 2 match those calculated in Step 4.
[edit] Step 5: Parasitic Loads
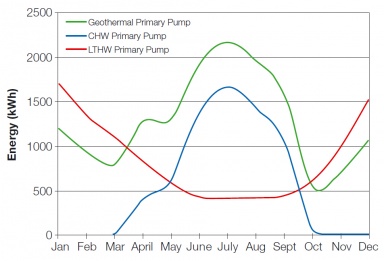
When conducting a comparative analysis of potential heating and cooling plant options, it is essential that the parasitic loads (pump power, cooling tower fans etc) associated with each option are accounted. Depending upon whether a constant or variable speed pumping strategy is implemented, the contribution of parasitic loads to the overall system energy consumption can be significant. Figure 13 shows the annual variation in Geothermal, CHW and LTHW pump energy consumption.
Figure 13 Annual circulation pump energy consumption – monthly data
[edit] Step 6: Comparative Analysis
In order to gain some perspective on the relative performance of a Closed Loop Geothermal Heat Pump it is necessary to obtain comparative data for alternate heating and cooling system options. Ideally that data should be derived from the same annual heating and cooling loads used in the analysis of the Closed Loop Geothermal Heat Pump.
[edit] Imbalanced annual heating and cooling loads
The simulation process described in the previous section uses as its example a somewhat idealised scenario in which the annual heat of abstraction is almost exactly equal to the annual heat of rejection. This results in an annual geothermal leaving water temperature profile that starts on 1 January at 8°C and ends on 31 December at the same 8°C (see Figure 6). It is infrequently the case that a building will exhibit such a fortuitously balanced heating and cooling load profile.
[edit] Heating dominated loads
Where the annual heating and cooling load profile is heavily heating dominated, the imbalance will result in a far greater quantity of heat being abstracted from the ground during the heating season than is replenished during cooling. Over successive years, this results in a gradual drop in the temperature of the earth surrounding the geothermal bores.
The drop in leaving water temperature from the bore field will be accompanied by a gradual drop in heating COP and a consequential increase in operating costs. The peak heating capacity of the heat pumps will also gradually fall.
The drop in earth temperature will actually improve the cooling COP of the heat pumps. However, since the load profile is so heavily heating dominated, the reduction in annual cooling energy consumption is relatively insignificant compared to the increase in heating energy.
[edit] Cooling dominated Loads
The impacts of a heavily cooling-dominated load profile are fundamentally similar but in reverse. There is a gradual rise in earth temperature over successive years, and consequential reduction in cooling COP. The increase in earth temperature and the reduction in COP are non-linear. As the temperature of the ground increases the heat loss to its surroundings also increases. Furthermore, at higher geothermal leaving water temperatures the quantity of heat rejected into the ground will begin to level off as the heat pumps are no longer able to meet peak cooling load requirements. The result of these phenomena is that the mean annual earth temperature will eventually reach a balance point: in one recent simulation this was reached after approximately 12 years of operation.
[edit] Mitigation of imbalanced loads
Despite the negative impacts described above, an imbalanced load profile need not preclude the use of a Closed Loop Geothermal Heat Pump system. Described under the following headings are various mitigating measures that can be taken when dealing with imbalanced loads.
[edit] Increase the size of the geothermal bore field
A ‘solution’ that is often proposed when faced with the problem of imbalanced heating and cooling load profiles is to increase the size of the geothermal bore field. This is a costly option and not the most effective. An increase in the size of the bore field does nothing to address the imbalance in load, it merely slows down the inevitable increase/decrease in earth temperature.
[edit] Load shifting by modifying the MEP system design
A far more effective approach is to purposefully manipulate the heating and cooling load profiles by modifying the Mechanical, Electrical, and Plumbing (MEP) system design. For example, a cooling dominated load profile can be brought back into balance, at least in some part, by making a design change from electric resistance humidifiers to evaporative type.
[edit] Bivalent systems – load side
Imbalances in annual heating and cooling load can also be addressed by sizing the system to meet a base load, while top-up boilers and/or chillers are used to meet peak load requirements. This dual approach is commonly referred to as a ‘bivalent system’. Aside from load balancing purposes a bivalent system design approach often results in the optimum payback period for a Closed Loop Geothermal Heat Pump installation. The problem with a bivalent approach is that it requires the reintroduction of equipment such as chillers, cooling towers, flues etc, the elimination of which may have been one of the drivers for selecting a Closed Loop Geothermal Heat Pump system in the first place.
[edit] Bivalent system – source side
An alternative bivalent system approach to the problem of imbalanced loads is to target the source side of heat pumps rather than the load side. This means that the heat pumps provide 100% of the heating and cooling load but that the geothermal bore field is supplemented in dealing with the heat of abstraction and rejection. For example, with a cooling dominated load profile the heats of abstraction and rejection from and to the bore field can be put into balance by rejecting a portion of the heat via the cooling tower.
In addition to summer time heat rejection operation, a cooling tower can help to balance a cooling dominated load profile by operating during winter. Running the tower during the winter effectively imposes a ‘false’ heating load on the bore field, pre-cooling the earth surrounding the geothermal bores and thereby reducing temperature rise during summer.
For heating-dominated load profiles a similar balancing effect can be achieved using a bivalent system approach whereby solar thermal collectors impose a false cooling load during summer.
This article was created by --Buro Happold 17 March 2013, based on a 2008 article in 'Patterns'.
[edit] Related articles on Designing Buildings Wiki
- BSRIA domestic hot water heat pumps testing.
- Computational Fluid Dynamics.
- Dynamic thermal modelling.
- Earth-to-air heat exchangers.
- Geothermal energy.
- Geothermal pile foundations.
- Ground source heat pumps.
- Ground energy options.
- Ground preconditioning of supply air.
- Heat pump.
- Thermal comfort.
- Thermal dynamic analysis.
- Thermal labyrinths.
Featured articles and news
A case study and a warning to would-be developers
Creating four dwellings... after half a century of doing this job, why, oh why, is it so difficult?
Reform of the fire engineering profession
Fire Engineers Advisory Panel: Authoritative Statement, reactions and next steps.
Restoration and renewal of the Palace of Westminster
A complex project of cultural significance from full decant to EMI, opportunities and a potential a way forward.
Apprenticeships and the responsibility we share
Perspectives from the CIOB President as National Apprentice Week comes to a close.
The first line of defence against rain, wind and snow.
Building Safety recap January, 2026
What we missed at the end of last year, and at the start of this...
National Apprenticeship Week 2026, 9-15 Feb
Shining a light on the positive impacts for businesses, their apprentices and the wider economy alike.
Applications and benefits of acoustic flooring
From commercial to retail.
From solid to sprung and ribbed to raised.
Strengthening industry collaboration in Hong Kong
Hong Kong Institute of Construction and The Chartered Institute of Building sign Memorandum of Understanding.
A detailed description from the experts at Cornish Lime.
IHBC planning for growth with corporate plan development
Grow with the Institute by volunteering and CP25 consultation.
Connecting ambition and action for designers and specifiers.
Electrical skills gap deepens as apprenticeship starts fall despite surging demand says ECA.
Built environment bodies deepen joint action on EDI
B.E.Inclusive initiative agree next phase of joint equity, diversity and inclusion (EDI) action plan.
Recognising culture as key to sustainable economic growth
Creative UK Provocation paper: Culture as Growth Infrastructure.


