Composition of UK construction industry 2013
Construction in the UK accounts for approximately 3 million jobs, 10% of total UK employment (ref Construction 2025) and includes both manufacturing and services.
In July 2013, the Department for Business, Innovation and Skills (BIS) published UK Construction, An economic analysis of the sector. This was based on Office for National Statistics (ONS) Annual Business Survey (2011 provisional results) and BIS analysis of ONS Labour Force Survey micro-data (January – March 2013 data).
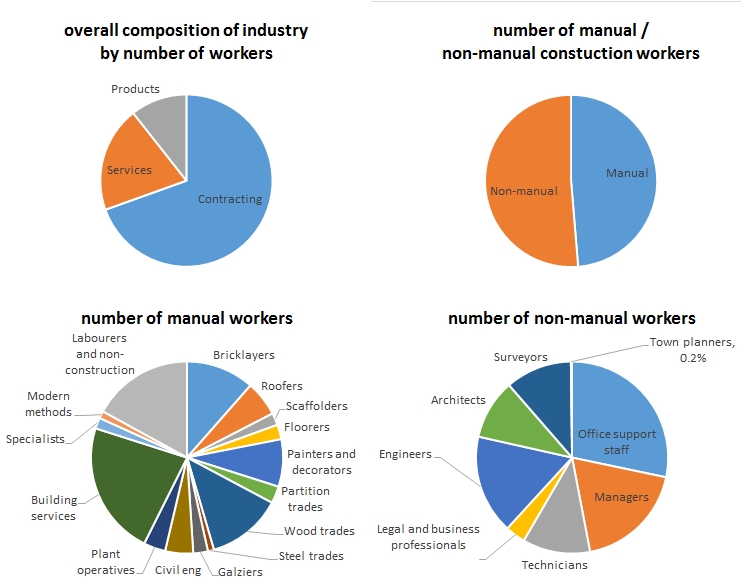
The report found that the industry is made up as follows:
- Contracting: 2,030,000 jobs, 234,000 businesses, gross value added (GVA) £63 billion.
- Services: 580,000 jobs, 30,000 businesses, gross value added, £14 billion.
- Products: 310,000 jobs, 18,000 businesses. gross value added, £13 billion.
According to BIS, the definition of these categories is as follows:
Contracting include activities such as:
- Construction of buildings e.g. commercial, residential.
- Civil engineering e.g. roads, tunnels, bridges, utilities.
- Specialised construction activities e.g. electrical and plumbing installation, demolition and site preparation, plastering, painting, roofing etc.
Services include activities such as:
- Architectural and quantity surveying activities.
- Wholesale of wood, construction and materials.
- Wholesale of hardware, plumbing and heating equipment.
- Renting and leasing of construction equipment etc.
Products, include the manufacture of construction products and materials such as:
- Bricks, tiles, cement, concrete products and plaster.
- Metal structures, doors and windows of metal, carpentry and joinery etc.
- Wiring devices, electric lighting equipment etc.
The definition excludes distribution and sales of construction products.
In March 2012, NatCen Social Research published a Survey of Employment by Occupation in the Construction Industry, based on a 2011 survey managed by ConstructionSkills (CITB Construction Industry Training Board).
The report found that 48.7% of workers in the construction industry were manual workers, whilst 51.3% were non manual. These workers were broken down as follows:
Non manual:
- Office support staff, 28.3%
- Managers, 18.7%
- Technicians, 11.4%
- Legal and business professionals, 3.4%
- Engineers, 16.7%
- Architects, 10.1%
- Surveyors, 11.2%
- Town planners, 0.2%
Manual:
- Bricklayers, 11.5%
- Roofers, 5.9%
- Scaffolders, 2.0%
- Floorers, 2.5%
- Painters and decorators, 8.0%
- Partition trades, 2.9%
- Wood trades, 12.7%
- Steel trades ,1.0%
- Galziers, 2.5%
- Civil engineering, 4.7%
- Plant operatives, 3.7%
- Building services, 22.5%
- Specialists, 1.8%
- Modern methods, 1.2%
- Labourers and non-construction, 17.0%
[edit] Find out more
[edit] Related articles on Designing Buildings Wiki
- Construction 2025.
- Construction industry statistics.
- Government departments responsibility for construction.
- UK construction industry.
[edit] External references
- BIS, UK Construction, An economic analysis of the sector, July 2013.
- NatCen Social Research Survey of Employment by Occupation in the Construction Industry, March 2012.
Featured articles and news
UKCW London to tackle sector’s most pressing issues
AI and skills development, ecology and the environment, policy and planning and more.
Managing building safety risks
Across an existing residential portfolio; a client's perspective.
ECA support for Gate Safe’s Safe School Gates Campaign.
Core construction skills explained
Preparing for a career in construction.
Retrofitting for resilience with the Leicester Resilience Hub
Community-serving facilities, enhanced as support and essential services for climate-related disruptions.
Some of the articles relating to water, here to browse. Any missing?
Recognisable Gothic characters, designed to dramatically spout water away from buildings.
A case study and a warning to would-be developers
Creating four dwellings... after half a century of doing this job, why, oh why, is it so difficult?
Reform of the fire engineering profession
Fire Engineers Advisory Panel: Authoritative Statement, reactions and next steps.
Restoration and renewal of the Palace of Westminster
A complex project of cultural significance from full decant to EMI, opportunities and a potential a way forward.
Apprenticeships and the responsibility we share
Perspectives from the CIOB President as National Apprentice Week comes to a close.
The first line of defence against rain, wind and snow.
Building Safety recap January, 2026
What we missed at the end of last year, and at the start of this...
National Apprenticeship Week 2026, 9-15 Feb
Shining a light on the positive impacts for businesses, their apprentices and the wider economy alike.
Applications and benefits of acoustic flooring
From commercial to retail.
From solid to sprung and ribbed to raised.
Strengthening industry collaboration in Hong Kong
Hong Kong Institute of Construction and The Chartered Institute of Building sign Memorandum of Understanding.
A detailed description from the experts at Cornish Lime.


