


Geographic Information Systems: QGIS
|
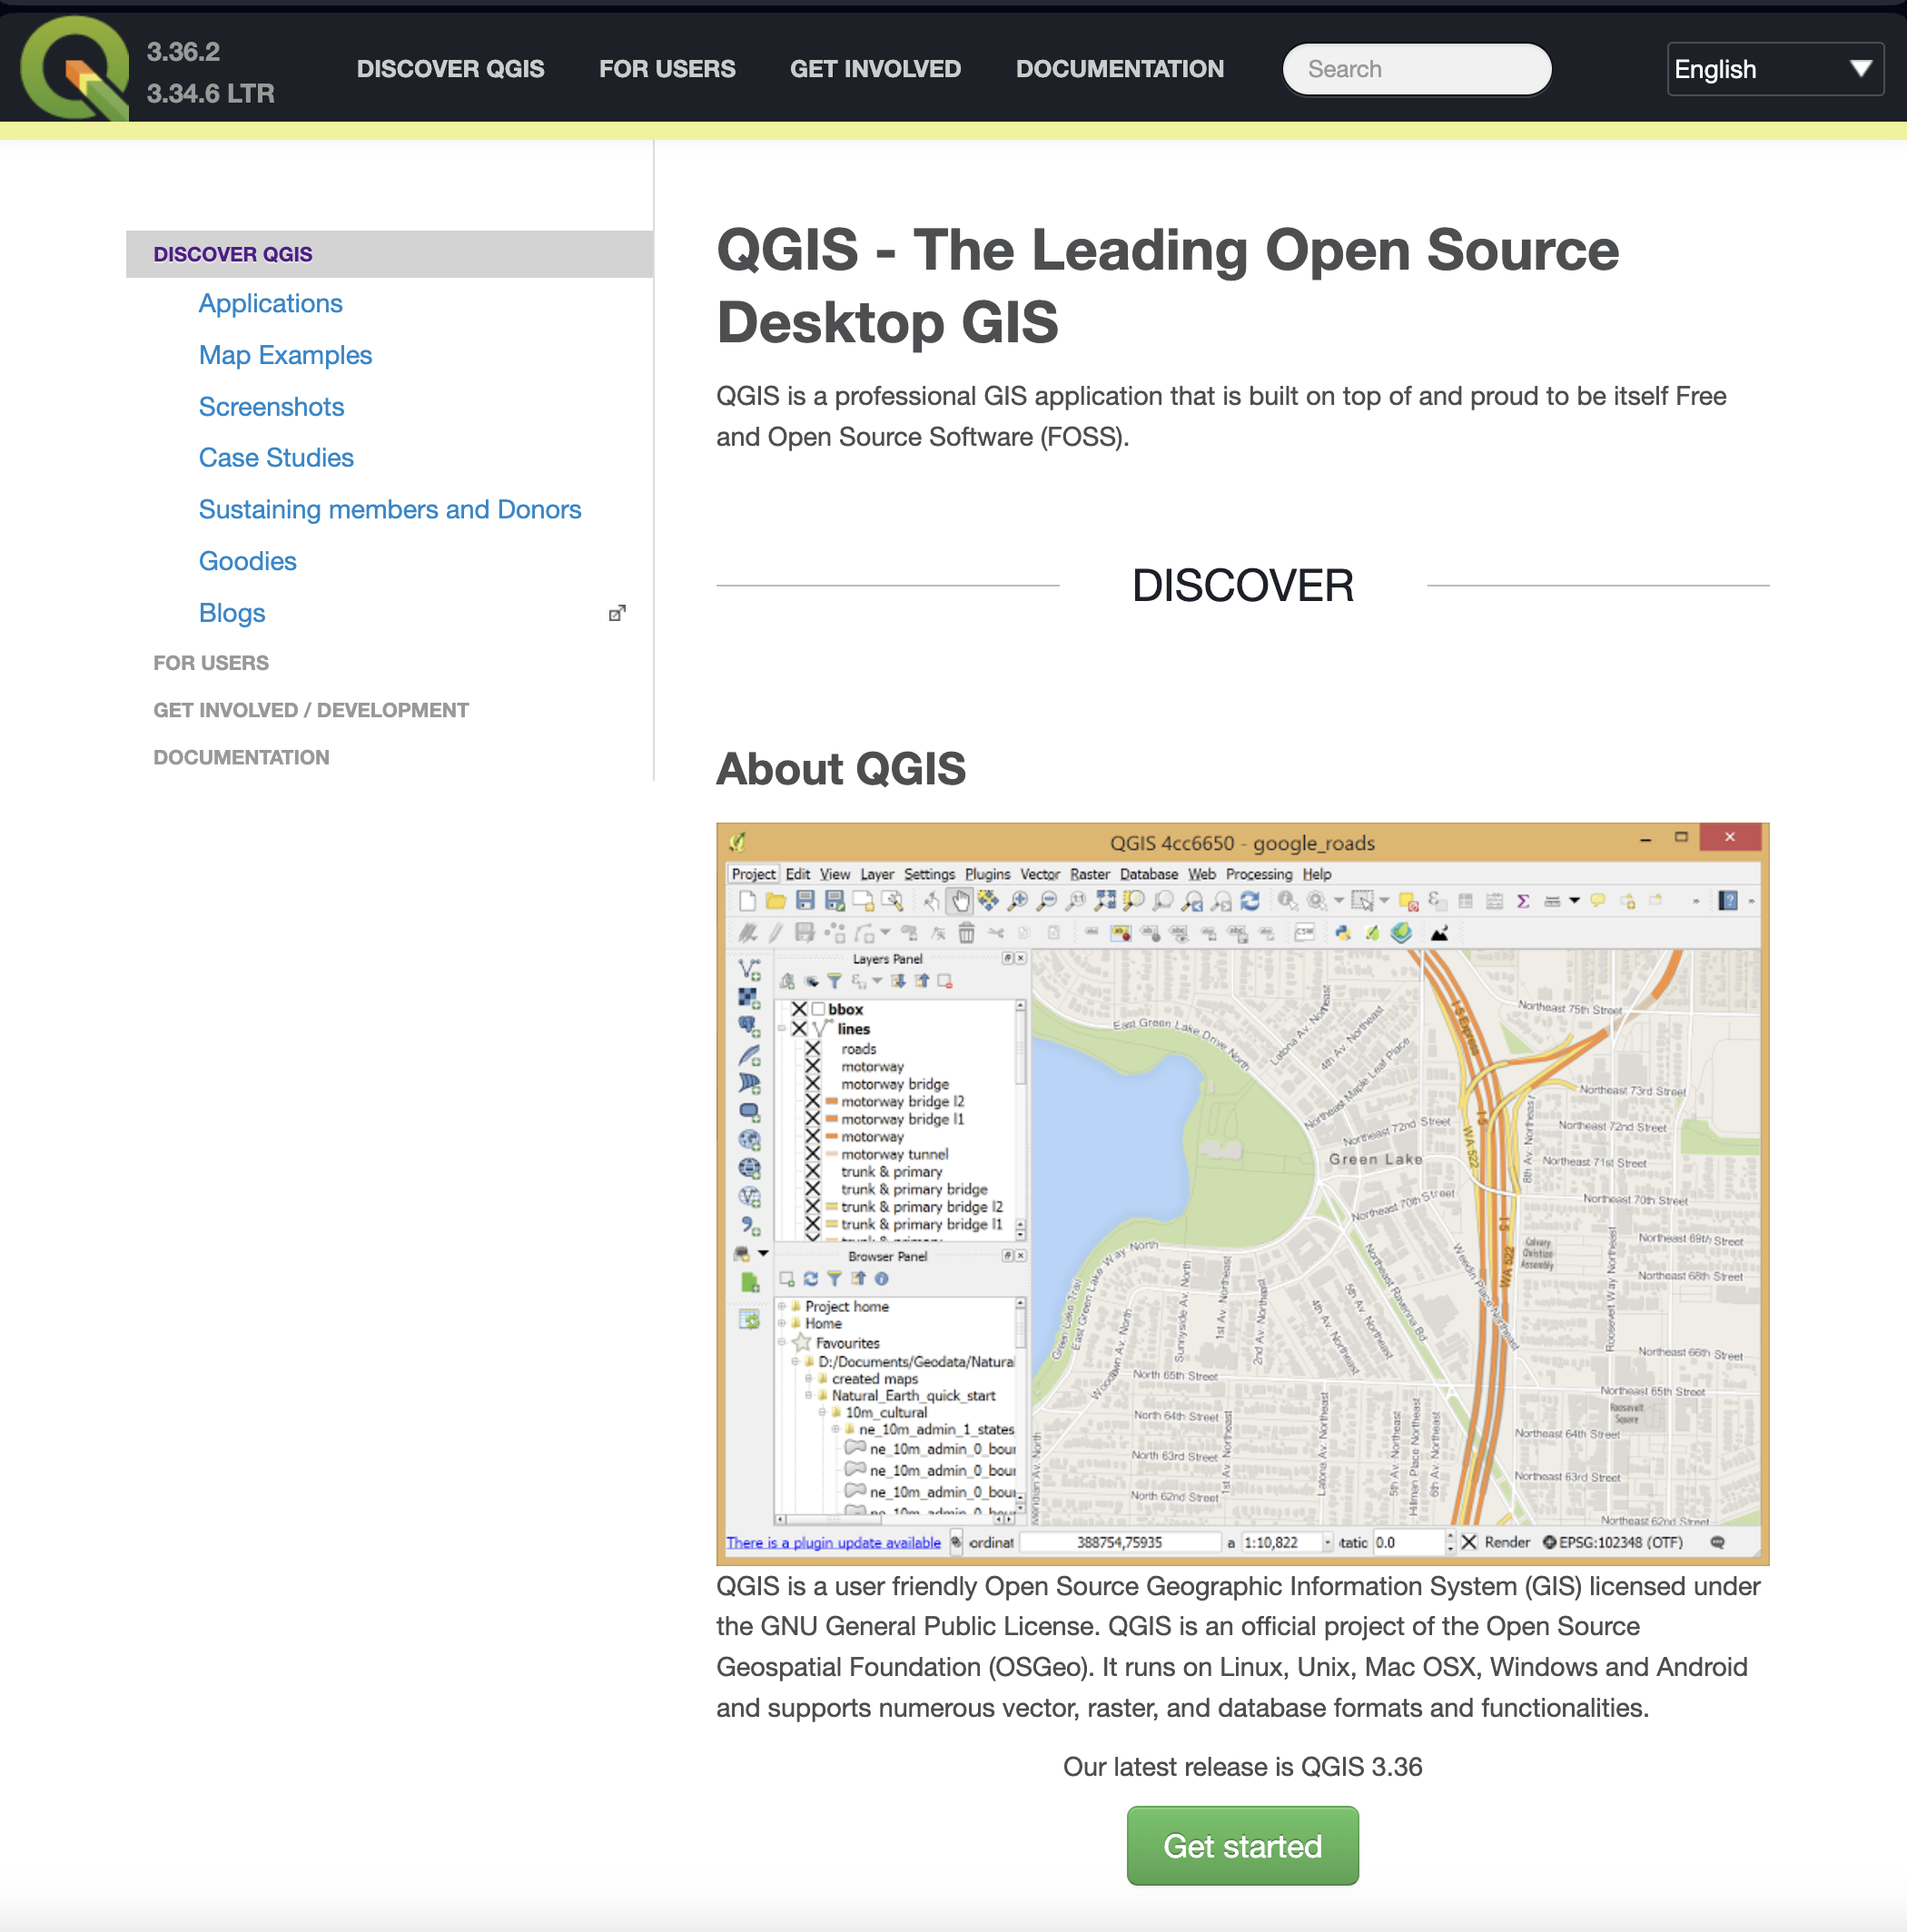
• Screenshot from the QGIS website. Click here to visit. |
[edit] FOREWORDQGIS is a free and open source GIS software for beginners and experienced users.
|
[edit] INTRODUCTION
On February 2, 2024, Matt Forrest posted a video entitled 'Learn GIS - QGIS Full Course for Beginners (New for 2024)'.
This article assumes:—
- ... that 'Learn GIS - QGIS Full Course for Beginners (New for 2024)' is a good starting point from which to learn GIS.
It therefore presents a review of the video.
[edit] Review
|
• Table 1: List of key points in the video with times linking to them in the video.
[edit] Keyframes
|
QGIS offers various resources like training materials, user groups, and project involvement options for users. The software has evolved over the years with multiple versions, plugins for extension, cross-platform compatibility, and open-source deployment capabilities. |
Download the appropriate version for your operating system by clicking download and following the installation steps. For Mac users, drag the downloaded file into the applications folder, overwrite the previous version if necessary, and proceed with the installation. |
Explanation of starting a new project and navigating the interface. |
Projections can be viewed and changed in the project settings. The toolbar offers various preset options for working with maps. |
|
You can change settings and access various tools in the customizable top toolbar. The different menus provide access to a wide range of tools including vector, raster, and database tools. |
Options for exporting nonspatial data like CSV with potential polygon features. Differences between exporting options like KML, KMZ, shapefile, and geojson, with a recommendation for using geojson for simplicity. |
Layers can be added to the map by right-clicking on them or dragging and dropping into the layer space. Once the layer is added, data will populate on the map, allowing for zooming in and exploring at a granular level. |
These layers include NYC parks Forever Wild map for ecologically important resources, Park permits for event setups, bike routes across the city, and even a unique squirrel census tracking fur colour. Adding and visualizing these layers in QGIS to analyze different aspects of park data. |
|
Installing the Quick Map Services plugin to add a base map. Upgrading the plugin and saving the map. |
Understanding layer rendering and order on the map. Managing layers, reordering, and toggling them. |
QGIS allows users to easily change projections for map visualizations. Users can explore and experiment with different projections for their maps. |
Using categorized option to colour or style data based on categorical values in the dataset. Ability to customize colours and styles for different values and add Legends for better visualization. |
|
Ability to change symbol size, opacity, remove stroke, and even do rotation. Option to visualize numeric data through downloading specific datasets like the New York City tree census. |
Use ‘Add Vector Layer’ to input latitude and longitude values. Ensure correct spelling and projections (e.g., 4326) for accurate data display. |
Adjust field data types using Processing Toolbox in QGIS. Convert stump diameter field from text to decimal for accurate representation. |
Identifying and removing data with many zero values to improve visualization accuracy. Adjusting symbol sizes based on data attributes for clearer interpretation. |
|
Symbol sizes can be customized from 2 to 18 for variance. Further styling options include zoom-based controls and legend formatting adjustments. |
Options for rule-based labeling and handling overlaps. Ability to edit vector data, such as polygons, for customization. |
Select the layer you want to edit by toggling editing or using the pencil icon. Adjust vertices of the polygon layer to ensure accuracy by adding or moving vertices. |
Toggle editing and trace the building shape by adding new shapes. Utilize vertices and functions like panning to create accurate polygon layers. |
|
Creating a new print layout to open the map view. Options to export the map as SVG or PDF, adding legends, pictures, and scale bars. |
Various plugins like mmqgis, qgis to web, Google Earth engine are available for QGIS. Access and use plugins by installing them through QGIS interface. |
Reproject data to change projection for accurate measurements. Create buffers around features to analyze spatial relationships. |
Use algorithms to detect and count points within polygons. Easily create and save models for repeated analysis, with options to customize styles and export as a script. |
|
Importing a 1 foot digital elevation model with large data size (3.5 GB). Exploring park boundaries and observing features like reservoir and flat areas. |
Various tools available for analyzing raster data such as reclassifying, zonal statistics, and raster creation. Ability to convert raster to vector data, demonstrating elevation changes within a park using Hillshade analysis. |
Interpolating elevation data is a common analysis, done to create elevation maps. Using the processing toolkit to generate contoured layers and style them by elevation. |
Enrich vector data with raster data for value extrapolation. Utilize network analysis tools like shortest path and service area for bike path mapping. |
|
Specify file name, geometry type (point), and IDs for points. Toggle editing, add multiple points with IDs on map, and save editing. |
Options for exporting layers and adjusting appearance. |
Ability to format and customize pop-up data in the web map. Integration with new tools and mapping programs for data sharing and hosting. |
Web map designed for a workshop in May 2024. Source: Norman Fellows. |


• Table 2: Thumbnails of selected frames from Matt Forrest's video outlining the process of learning QGIS - click to enlarge. Times link to key points in the video.
[edit] Links
2015 Street Tree Census - Tree Data
2018 Squirrel Census Fur Color Map
[edit] References
Matt Forrest (2024) 'Learn GIS - QGIS Full Course for Beginners (New for 2024)', YouTube.
NYC (2022) 'NYC Open Data', New York City agencies and other partners.
QGIS (2024) 'QGIS - The Leading Open Source Desktop GIS', qgis.org
Wikipedia Contributors (2024) 'QGIS', Wikipedia.
[edit] Further reading
Norman Fellows (2024) 'Transcript: 'Learn GIS - QGIS Full Course for Beginners', extremelyprovocative.wordpress.com
[edit] Related articles on Designing Buildings
Geographic Information Systems (GIS)
--Archiblog 10:54, 01 May 2024 (BST)
Featured articles
Check out some of the best features and news from Designing Buildings as well as key stories from around the web.

ECA welcomes plans to strengthen subcontractor quality control.

Combining mid-career qualifications with experience broadens career opportunities.
![]()
Why being a mentor can help your career.

Channel 4 broadcaster to host 125th anniversary ceremony.
Listed structures on the rail network
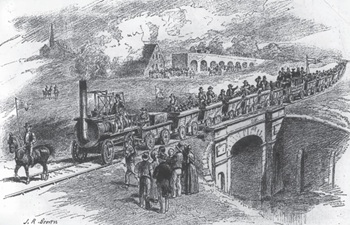
Heritage interests and operational requirements must be balanced.
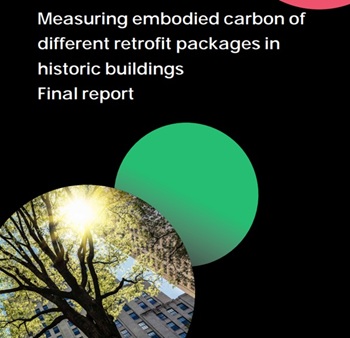
Historic England publishes research into embodied carbon when retrofitting traditional buildings.

New Prime Minister delivers on ECA call for cut in electricity costs.

CIOB reacts to the announcement of Andy Burnham as Prime Minister.

Heritage and conservation science workforce survey - Have your say.

England's Suburbs 1820-2020. Book review.

New, more proportionate and targeted approach for higher-risk building assessments.

Government brings British Steel into public ownership.