


Psychrometric charts

BG 87/2024, Useful Information Guide, written by Chin Hang “Kay” Lam and published by BSRIA in 2024, defines Psychrometrics as: ‘The study of the properties of moist air, including properties such as relative humidity, dry bulb temperature and wet bulb temperature.’
Psychrometric charts are complex graphs that can be used to assess the physical and thermodynamic properties of gas-vapour mixtures at a constant pressure. They are often used to assess the properties of moist air. This can be useful in the design of heating, ventilation and air-conditioning systems for buildings, and psychrometric charts often include a zone in the middle that represents the range of conditions that people find comfortable under different circumstances (such as summer and winter).
Typically, the properties represented on psychrometric charts are:
- Dry-bulb temperature: A measure of air temperature recorded by a thermometer exposed to the air but shielded from radiation and moisture.
- Wet-bulb temperature: The temperature recorder by a thermometer that has its bulb wrapped in cloth and moistened with distilled water. The rate of evaporation from the wet bulb, and so the temperature it records varies depending on the humidity of the air it is exposed to.
- Relative humidity: The ratio of the actual vapour pressure relative to the vapour pressure of saturated air at the same temperature, expressed as a percentage.
- Specific volume: The volume of a unit weight of dry air.
- Dew point temperature: The highest temperature at which water vapour will condense.
- Humidity ratio: The dry-basis moisture content of air expressed as the weight of water vapour per unit weight of dry air.
- Enthalpy: The energy content of air.
The state of moist air can be determined from any two of these properties, from which all other properties can then be determined.
Atmospheric pressure varies with altitude and so a number of psychrometric charts are available for different atmospheric pressures, however, for altitudes of less than 600m the sea-level psychrometric chart is often considered adequate.
[edit] Related articles on Designing Buildings
Featured articles
Check out some of the best features and news from Designing Buildings as well as key stories from around the web.
Construction Management, 10 June

24 months to 14: CITB launches accelerated apprenticeships.
Bridging the gap between clients and contractors

Concerns remain around contractor quality, capability, and delivery.
Construction Management, 10 June.
Heat pumps beat boilers in new home tests.
Building Safety Act implementation in Wales

CIAT to host industry panel on 26 June.
![]()
New and updated CLC building safety guidance.
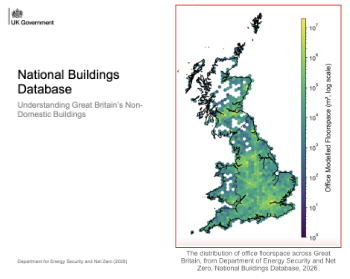
New UK National Buildings Database.
Building Safety Wiki Interviews

Chief executive of the British Woodworking Federation.
Planning condition discharge in England and Wales

A brief explanation from a building compliance expert, with further links.
Overheating guidance and tools for building designers

Guidance for dealing with element of building fabric control that have increasing importance.
Shading for housing, a design guide

From the Good Homes Alliance and British Blind and Shutter Association.
UK Standard Skills Classification (SSC)

A shared framework for describing skills needs.
Comments
Who is the author of this article? I cant find the name.
Designing Buildings Wiki is a wiki site – articles are developed over a period of time by our users. As such, there is no specific author. To reference an article on the site, just reference Designing Buildings Wiki as the publisher, and the date that you accessed it.