


Line of balance (LOB)
Line of balance (LOB) is a management control process used in construction where the project contains blocks of repetitive work activities, such as roads, pipelines, tunnels, railways and high-rise buildings. LOB collects, measures and presents information relating to time, cost and completion, and presents it against a specific plan.
LOB assists project management by:
- Comparing a formal objective against actual progress.
- Examining the extent of any deviations from specific plans, in terms of knock-on effects.
- Identifying in advance problematic areas where corrective action may be required.
- Forecasting future performance.
The LOB technique was created by the Goodyear Company in the early 1940s, before being adopted and developed by the U.S. Navy in the early-1950s. It was subsequently developed for industrial manufacturing and production control, as well as the basic concepts behind planning and scheduling in the construction industry.
An LOB diagram shows the repetitive project work as a single line on a graph. It differs from a bar chart which shows a particular activity’s duration, by showing the rate at which the work has to be undertaken to stay on schedule, as well as the relationship of one trade or process to the subsequent trade or process.
The project timeline is represented along the x-axis of the LOB diagram. The work areas that define the project are represented along the y-axis. This is the starting point for the LOB schedule:

In the figure below, it can be seen that Activity A lasts a 10 weeks. The productivity of A, spread across each of the work areas, is 2 weeks per floor.

If Activity B has a productivity rate of 1 week per floor, then it can begin work at the end of the second week.

As Activity B continues, at the end of the week 4 work can begin on the second floor; at the end of week 6 work can begin on the third floor, and so on. The horizontal red dashed lines represent the breaks in Activity B work, where the workforce is waiting for Activity A to clear the way for them to continue. In this example, starting Activity B as soon as possible will result in a lost productivity of 4 weeks.

The diagram below shows that by delaying the start of Activity B for 4 weeks, the workforce can continue uninterrupted, and hence are more productive. This enables a better understanding of how workforces follow one another through activities.

The advantages of LOB include:
- Allowing a clearer understanding of the amount of work taking place at a certain time in a specific place.
- Resources can be optimised for a large number of repeated work activities.
- As all information is available for each activity, it allows easier cost and time optimisation analysis.
- It is relatively easy to modify, update and change the schedule.
- It allows better management of subcontractors and resources.
- It allows problem areas to be identified in advance.
[edit] Find out more
[edit] Related articles on Designing Buildings Wiki
- Activity schedule.
- Advanced manufacturing.
- Block planning.
- Clash avoidance.
- Critical path method.
- Design coordination.
- Gantt chart.
- Key dates.
- Logistics management.
- Milestones.
- Pareto analysis.
- Programme for building design and construction.
- Project manager.
- Resource leveling.
- Scheduling construction activities.
- Time-location chart.
- Time management of construction projects.
[edit] External resources
- CPM Tutor - Line of balance
Featured articles
Check out some of the best features and news from Designing Buildings as well as key stories from around the web.

ECA welcomes plans to strengthen subcontractor quality control.

Combining mid-career qualifications with experience broadens career opportunities.
![]()
Why being a mentor can help your career.

Channel 4 broadcaster to host 125th anniversary ceremony.
Listed structures on the rail network
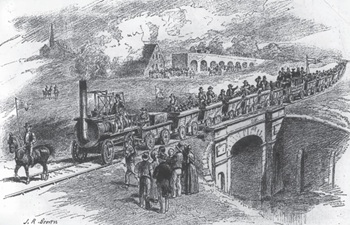
Heritage interests and operational requirements must be balanced.
Historic England publishes research into embodied carbon when retrofitting traditional buildings.

New Prime Minister delivers on ECA call for cut in electricity costs.

CIOB reacts to the announcement of Andy Burnham as Prime Minister.

Heritage and conservation science workforce survey - Have your say.

England's Suburbs 1820-2020. Book review.

New, more proportionate and targeted approach for higher-risk building assessments.

Government brings British Steel into public ownership.