


Water deprivation potential WDP
Water Deprivation Potential (WDP) may be referred to as Water Scarcity Footprint (likely to be abbreviated to WSP, due to the related term Water Supply Footprint or WSF) or product water footprint.
The water footprint of a product is the amount of water that is consumed or polluted in all processing stages of its production. A product water footprint quantifies how much pressure that product has put on freshwater resources. It can be measured in cubic metres of water per tonne of production, or litres per kilogram or gallons per pound. Notably the variables in the calculation of water footprint will vary depending on location, season but also on a yearly basis depending on the occurrence of extreme weather events such as drought.
Water footprints can be calculated for an individual person, a process, a product’s entire value chain or for a business, a river basin or a nation. Lack of water to drink, wash, feed crops, and use for sanitation can lead a variety of life threatening situations locally or globally, directly or via water-borne illnesses. When the amount of renewable water available in a country is below 1,700 m3 per person per year, the country is said to be experiencing water stress, below 1,000 m3 it is said to be experiencing water scarcity and below 500 m3, absolute water scarcity (UN).
Water scarcity in general is calculated by subtracting the recommended use fraction (0.4) from the ratio of total freshwater withdrawals of surface, renewable and fossil ground water to total renewable water resources (EPI).
Water Deprivation Potential (WDP) is used as an environmental impact indicator of EN 15804:2012+A2:2019/AC:2021 which is used as guidance in the generation of the lifecycle assessment (LCA) methodology used to create Product Environmental Footprints (PEF). It is also considered as one of the environmental performance indicators for the calculation, assessment and generation of environmental product declarations (EPDs), which makes reference to the available water remaining (AWARE) method.
The AWARE method is based on the inverse of the difference between water availability per area and demand per area. It quantifies the potential for water deprivation, to either humans or ecosystems, and serves in calculating the impact score of water consumption at midpoint in LCAs or to calculate a water scarcity footprint as per ISO 14046. It is based on the available water remaining (AWARE) per unit of surface in a given watershed relative to the world average, after human and aquatic ecosystem demands have been met. This is represented by a characterisation factor (CF) calculated separately for a country, region or place at an average set point in time and ranges between 0.1 and 100. The CF is then multiplied by the local water consumption inventory to give an equivalent or WDP-eq
The AWARE method first calculates the water availability minus the demand (AMD) of humans and aquatic ecosystems relative to the area (m3 m-2 month-1). Second, the value is normalised with the world average result (AMD = 0.0136m3m-2 month-1) and inverted, and hence represents the relative value in comparison with the average m3 consumed in the world (the world average is calculated as a consumption-weighted average). Once inverted, 1/AMD can be interpreted as a surface-time equivalent to generate unused water in this region. The indicator is limited to a range from 0.1 to 100, with a value of 1 corresponding to the world average, and a value of 10, for example, representing a region where there is 10 times less available water remaining per area than the world average. It is stated that the results of this environmental impact indicator should be used with care as the uncertainties of the results are high and as there is limited experience with the indicator it may sometimes also be referred to as deprivation-weigthed water consumption.
Ref: https://wulca-waterlca.org/aware/what-is-aware/
[edit] Related articles on Designing Buildings
Featured articles
Check out some of the best features and news from Designing Buildings as well as key stories from around the web.

New, more proportionate and targeted approach for higher-risk building assessments.

Government brings British Steel into public ownership.

UKCW Birmingham returns with bold new theme and focus.

New guidance published on competence requirements for self-certification schemes.
Construction Management, 8 July

NEETs crisis drives interest in trades, but apprenticeships barriers remain.
Passive fire protection webinar

MEP services penetration seals.

Where its at podcast (and video) - The role of the Architectural Technologist as an Expert Witness.
More than 200 remarkable buildings added to SAVE’s Buildings at Risk register.

Government scraps pre-application consultation for Nationally Significant Infrastructure Projects.
Historic England and infrastructure
New projects offer opportunities for the historic environment and local communities.
Construction Management, 2 July

Construction deaths halve in two years.
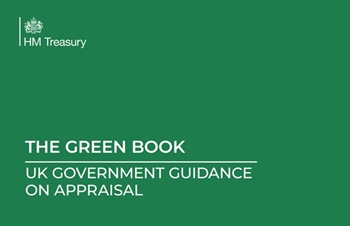
Green Book changes to drive investment in all parts of UK.