





Bryden Wood Creates Supply Chain Assessment Tool
In January 2018, Bryden Wood, the integrated design and operations consultancy for the built environment, announced it had created a Supply Chain Assessment tool to optimise the supply chain of clients.
The Supply Chain Assessment tool includes mapping across both global and UK filtered maps, divided in countries and counties. Each region is assessed and benchmarked based on its performance on a variety of critical factors. Value drivers such as cost, capability, capacity, quality, unemployment, population, Corruption Index, labour skills and product reach are all included. This functionality gives users a greater understanding of the supply chain, leading to better informed decision making. It can also be used to assess supplier suitability, weighting up all the requirements of the client, such as volumes, dimension, lead times and availability.
The Supply Chain Assessment tool is a standardised and flexible model using Tableau, a data visualisation software, which combines global data and maps applying different filters. It is connected on a variety of datasets, from Revit exports (COBie files) to global indices offering filtered maps with attached data and visualisations.
Vasileios Erinakis, Bryden Wood Lead Analyst, Modelling and Analytics commenting said: “We are bringing together multiple sources of data to form a data-rich map, which we think is unique. It features multi-layered information to enable clients to build up a detailed picture of an area, to help them find the most suitable sites for buildings, facilities and infrastructure. Providing this level of information will make finding the right locations much more efficient for clients, giving them a competitive advantage. For a manufacturing client of ours, we are assessing all countries based on the value drivers of the business case - where to operate (considering factors such a Corruption Index, skills and product reach) and of the design of the building (based on environmental factors such as temperature, wind speed, earthquakes). We will be able to make a conclusion and therefore a recommendation on a country that will meet all their requirements. On another project, the same model maps out all the suppliers under consideration, visually differentiating them based on their product offering and indicates the shortest route for them to site, enabling logistics optimisation. It assesses UK counties in order to find the most appropriate location for manufacturing hubs, where the different suppliers will send their components in order to be assembled off site using low skilled labour. Here the focus is on more socially-oriented value drivers, like unemployment, population and skills.”
Featured articles
Check out some of the best features and news from Designing Buildings as well as key stories from around the web.

Government approach could undermine delivery and regeneration.
World's first mass timber data centre.

The overlooked environmental aspect of data centre development.
Introduction to radon awareness
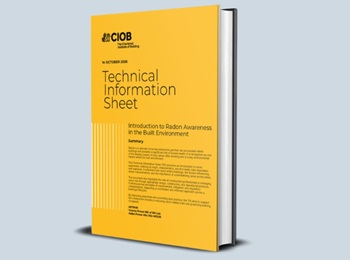
New technical information sheet published by CIOB.

Updated supplier guide can help electrical contractors engage with NHP.

CIAT confirm the winners of the 2026 architectural technology awards.

Government launches a one stop shop for flood preparedness.

Sir Edwin Lutyens: Britain's greatest architect? Book review.
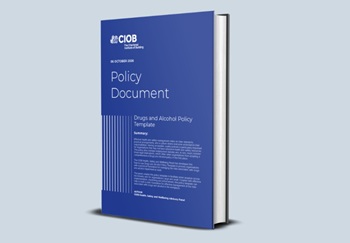
CIOB publishes free template to help assess and manage risks.
ECA's reflections on Party Conference season

Burnham wants to be confident of winning before asking for a fresh mandate.
New Chief Construction and Scientific Adviser

Sergio Cavalaro, Professor of Infrastructure Systems at Loughborough University.
Building safety levy for England

CIAT publish estimator tool for members.

Water sector faces a growing crisis that could slow the delivery of vital infrastructure.