


Psychrometric charts

BG 87/2024, Useful Information Guide, written by Chin Hang “Kay” Lam and published by BSRIA in 2024, defines Psychrometrics as: ‘The study of the properties of moist air, including properties such as relative humidity, dry bulb temperature and wet bulb temperature.’
Psychrometric charts are complex graphs that can be used to assess the physical and thermodynamic properties of gas-vapour mixtures at a constant pressure. They are often used to assess the properties of moist air. This can be useful in the design of heating, ventilation and air-conditioning systems for buildings, and psychrometric charts often include a zone in the middle that represents the range of conditions that people find comfortable under different circumstances (such as summer and winter).
Typically, the properties represented on psychrometric charts are:
- Dry-bulb temperature: A measure of air temperature recorded by a thermometer exposed to the air but shielded from radiation and moisture.
- Wet-bulb temperature: The temperature recorder by a thermometer that has its bulb wrapped in cloth and moistened with distilled water. The rate of evaporation from the wet bulb, and so the temperature it records varies depending on the humidity of the air it is exposed to.
- Relative humidity: The ratio of the actual vapour pressure relative to the vapour pressure of saturated air at the same temperature, expressed as a percentage.
- Specific volume: The volume of a unit weight of dry air.
- Dew point temperature: The highest temperature at which water vapour will condense.
- Humidity ratio: The dry-basis moisture content of air expressed as the weight of water vapour per unit weight of dry air.
- Enthalpy: The energy content of air.
The state of moist air can be determined from any two of these properties, from which all other properties can then be determined.
Atmospheric pressure varies with altitude and so a number of psychrometric charts are available for different atmospheric pressures, however, for altitudes of less than 600m the sea-level psychrometric chart is often considered adequate.
[edit] Related articles on Designing Buildings
Featured articles and news
The UK's Modern Industrial Strategy: A 10 year plan

Previous consultation criticism, current key elements and general support with some persisting reservations.
Building Safety Regulator reforms
New roles, new staff and a new fast track service pave the way for a single construction regulator.
Architectural Technologist CPDs and Communications

CIAT CPD… and how you can do it!
Cooling centres and cool spaces
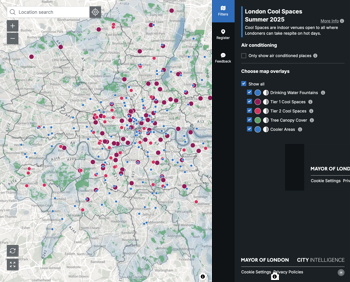
Managing extreme heat in cities by directing the public to places for heat stress relief and water sources.
Winter gardens: A brief history and warm variations

Extending the season with glass in different forms and terms.
Restoring Great Yarmouth's Winter Gardens

Transforming one of the least sustainable constructions imaginable.
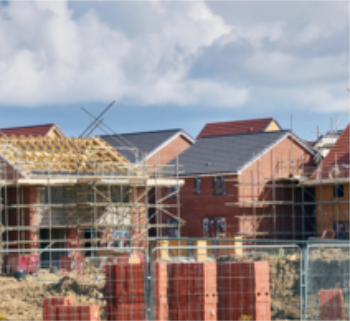
Construction Skills Mission Board launch sector drive

Newly formed government and industry collaboration set strategy for recruiting an additional 100,000 construction workers a year.
New Architects Code comes into effect in September 2025
ARB Architects Code of Conduct and Practice available with ongoing consultation regarding guidance.
Welsh Skills Body (Medr) launches ambitious plan

The new skills body brings together funding and regulation of tertiary education and research for the devolved nation.
Paul Gandy FCIOB announced as next CIOB President

Former Tilbury Douglas CEO takes helm.
UK Infrastructure: A 10 Year Strategy. In brief with reactions

With the National Infrastructure and Service Transformation Authority (NISTA).

Ebenezer Howard: inventor of the garden city. Book review.
The Grenfell Tower fire, eight years on
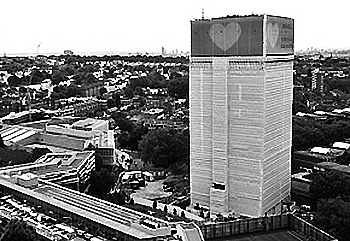
A time to pause and reflect as Dubai tower block fire reported just before anniversary.
Airtightness Topic Guide BSRIA TG 27/2025
Explaining the basics of airtightness, what it is, why it's important, when it's required and how it's carried out.
Construction contract awards hit lowest point of 2025

Plummeting for second consecutive month, intensifying concerns for housing and infrastructure goals.
Understanding Mental Health in the Built Environment 2025

Examining the state of mental health in construction, shedding light on levels of stress, anxiety and depression.
Comments
Who is the author of this article? I cant find the name.
Designing Buildings Wiki is a wiki site – articles are developed over a period of time by our users. As such, there is no specific author. To reference an article on the site, just reference Designing Buildings Wiki as the publisher, and the date that you accessed it.