


Time-location chart
A time-location chart is a graphical representation of a construction program against axes of time and location (distance). It is a communication tool for project management that is used to inform a team about what needs to be done and when, as clearly and efficiently as possible.
Most construction planning and scheduling is carried out using bar charts, also known as Gantt charts. These charts plot activities against time, making them useful for knowing what to do at a specific time, however, they do not show where the work is being carried out. For civil engineering projects such as pipelines, railways, tunnels and roads, or repetitive projects such as housebuilding or high-rise building, it can be beneficial to chart activities against time and location.
A Gantt chart plots time on the horizontal axis and activities on the vertical axis. In contrast, a time-location chart is much less fixed. Location (distance) is often plotted on the horizontal axis and time on the vertical, although it varies as to whether it runs from the earliest down to the latest date or vice versa. Typically, charts for road and tunnel projects start at the top and progress downwards; whereas projects for buildings and pipelines start at the bottom and progress upwards.
Activities are shown as a line or shape (boxes or symbols) in the main body of the chart, making it possible to view the activities that will be taking place in which location at any particular time. The geometrical shapes show the occupation of the site over time, and ensure that conflicting access can be detected visually. Different types of activity are identified by specific colours, fill patterns, line types or special symbols. A key is used to clarify what the different symbols represent.
The advantage of a time-location chart is that it illustrates all visible activities along a construction site on a single chart. However, care must be taken not to include too much detail, as clarity can be lost in place of complexity, moving away from the purpose of the chart which is to make the construction programme easily understandable.
[edit] Related articles on Designing Buildings Wiki
- Activity schedule.
- Construction management.
- Contractor’s master programme.
- Critical path method.
- Design web.
- Gantt chart.
- Key performance indicators.
- Line of balance (LOB).
- Milestones.
- Pareto analysis.
- Programme float.
- Programme for building design and construction.
- Project programme.
- Resource management.
- Scheduling construction activities.
- Time management of construction projects.
Featured articles and news
Getting the most out of heat pumps and heating

How heat pumps work and how they work best.
Plumbing and heating for successful retrofit and renovation
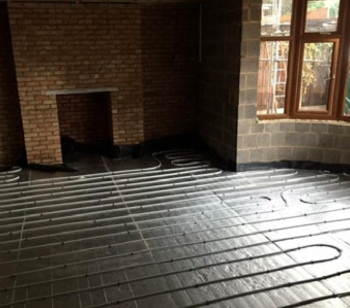
Low temperature underfloor systems and heat pumps.
Cost-of-living crisis and home improvement plans
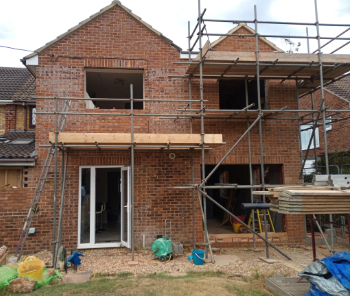
Starting on the right footing and top tips for projects.
Delays on construction projects

Types, mitigation and the acceleration of works.

From Chaucer to Fawlty Towers.

Electrotechnical excellence, now open for entries.
Net zero electricity grids BSRIA guide NZG 5/2024

Outlining the changes needed to transition to net zero.
CIOB Global Student Challenge 2024

Universitas Indonesia wins for second year running.

New project and cultural district described in detail.
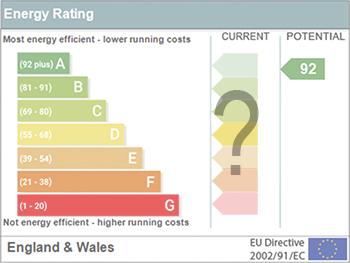
The nature of EPCs, crticism and inaccuracies.

History, issues and redesign.
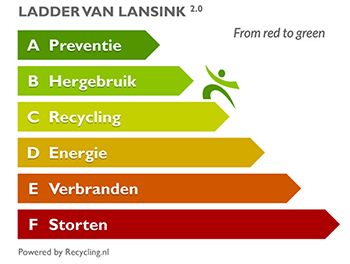
From waste recycling to energy performance the hierchy.
An introduction to WERCS and WEEE responsibilities

Dealing with 2 million tonnes of waste equipment a year.
Global BACS Market: analytics and optimisation

A BSRIA glance at building automation and control systems.

What it is and how to use it.

Types of insulating plaster by binder and insulant.
Investors in People: CIOB achieves gold

Reflecting a commitment to employees and members.

Scratching beneath the surface; a guide to selection.
ECA 2024 Apprentice of the Year Award

Entries open for submission until May 31.
UK gov apprenticeship funding from April 2024

Brief summary the policy paper updated in March.