


Design web for building design
No matter how big or small a project, knowing where you are in the design process and identifying where problems lie is absolutely fundamental to achieving a successful outcome, and in that, monitoring the design is crucial.
However, whilst designers may be asked to take on lead consultant or lead designer roles, many practices do not have in house management support. As a consequence, they may seek to improve the way their projects are managed, either by developing tools and techniques internally or by outsourcing this requirement to other, more suitable consultants.
This is not straight-forward, as design is not predictable, nor is it as sequential as the construction process. The construction process is typically scheduled using tools such as Gantt charts, where tasks are linked to show sequences of activities, dependencies and critical paths.
However, it can be argued that design is an activity-related as opposed to time-related process, and that the days have passed where architecture, structure and services designers worked independently and measuring design progress was simply a matter of counting drawings.
Designers also tend to b every visual individuals. Having to decipher a bar chart to determine design progress may not be something that comes naturally. This makes it a challenge to schedule and monitor design team activities and progress accurately and meaningfully.
The ‘Design Web’ provides an alternative method of monitoring and reporting on design activity and progress. Using fairly simple techniques, it is a very visual tool that allows designers to take a snapshot of the entire project at any time in the project life cycle. It is something that is used to ensure that all the pieces of the design jigsaw are being progressed and if not, instantly see where the problems or blockages lie.
This is also useful for showing progress to clients.

The ‘Design Web’ captures the design tasks necessary in any given period, weighted and presented in a simple graphical form that can be easily understood by all. They are used by design teams to assess progress and subsequently target effort and resources into the right areas, allowing them to produce a fully integrated and coordinated design. It enables everyone to clearly see where problems lie and where the team is progressing well.
Work begins in the centre of the web, and progress then ‘grows’ from the centre towards the outer edge that represents 100% completion.
There will always be a need to plot the design stages and key milestones in a linear way in a bar chart form (using a Gannt chart) as this provides a sequential plan showing how to progress through the project. However, just plotting design onto a Gannt chart and then drawing a line down it to reflect current progress does not accurately or usefully represent the real situation. Gannt charts are useful for plotting key milestone dates, key decision dates critical paths and so on, but not are not the only or the best tool for gauging design progress.
[edit] Related articles
Featured articles and news
Costs and insolvencies mount for SMEs, despite growth

Construction sector under insolvency and wage bill pressure in part linked to National Insurance, says report.
The place for vitrified clay pipes in modern infrastructure
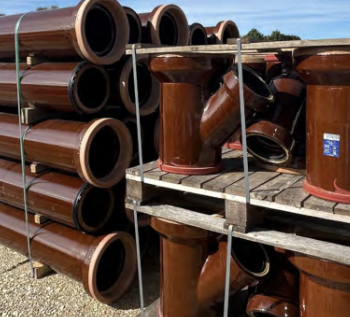
Why vitrified clay pipes are reclaiming their role in built projects.
Research by construction PR consultancy LMC published.
Roles and responsibilities of domestic clients

ACA Safety in Construction guide for domestic clients.
Fire door compliance in UK commercial buildings
![]()
Architect and manufacturer gives their low down.
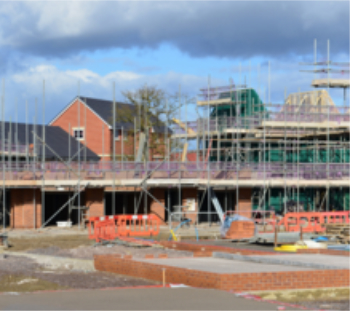
Plumbing and heating for sustainability in new properties

Technical Engineer runs through changes in regulations, innovations in materials, and product systems.
Awareness of the Carbon Border Adjustment Mechanism
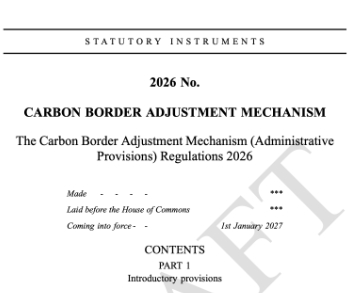
What CBAM is and what to do about it.
The new towns and strategic environmental assessments
12 locations of the New Towns Taskforce reduced to 7 within the new towns draft programme and open consultation.
Buildings that changed the future of architecture. Book review.
The Sustainability Pathfinder© Handbook
Built environment agency launches free Pathfinder© tool to help businesses progress sustainability strategies.

Government outcome to the late payment consultation, ECA reacts.
IHBC 2025 Gus Astley Student Award winners
![]()
Work on the role of hewing in UK historic conservation a win for Jack Parker of Oxford Brookes University.
Future Homes Building Standards and plug-in solar
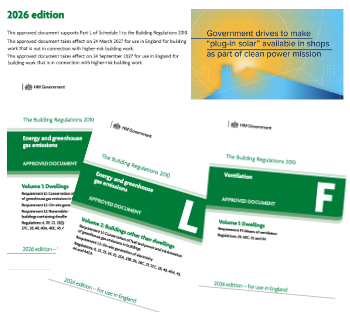
Parts F and L amendments, the availability of solar panels and industry responses.
How later living housing can help solve the housing crisis

Unlocking homes, unlocking lives.
Preparing safety case reports for HRBs under the BSA

A new practical guide to preparing structural inputs for safety cases and safety case reports published by IStructE.
Male construction workers and prostate cancer

CIOB and Prostate Cancer UK encourage awareness of prostate cancer risks, and what to do about it.