


Pareto analysis in construction

Pareto analysis is a statistical decision-making technique that identifies a limited number of input factors as having a greater impact on outcomes, whether they are positive or negative. It is based on the Pareto Principle, popularly known as the ‘80/20 rule’, that stipulates that 80% of the outputs result from 20% of the inputs.
The principle was developed by Vilfredo Pareto, a 19th century Italian economist and sociologist who was researching wealth distribution. He subsequently discovered the 80/20 rule applied to areas outside of economics, for example, 80% of the peas in his garden were produced by only 20% of the peapods planted.
Pareto analysis can also be used as a project management tool. For example, the majority of problems (80%) are produced by relatively few causes (20%); and 80% of the project’s benefits are delivered through 20% of the work.
Put simply, Pareto analysis shows that a disproportionate improvement can be made by ranking the various causes of a problem and allocating resources to tackling those that have the largest impact.
In construction, there may be a problem with the project programme that is the result of a large number of causes. Through observation and the collection of data, it might be determined that there are 8 causes. Pareto analysis may show that 80% of the problems result from the top 2 or 3 causes. The project management team can then plan an appropriate response, targeting resources at those 2 or 3 causes, rather than all 8.

A Pareto diagram (or chart) can be used to present the analysis, helping the project team to focus on the inputs with the greatest impact.
Inputs are listed along the horizontal ‘y’ axis in descending order of output frequency (using the cumulative percentage of the outputs), and uses a line graph to chart them. The vertical ‘x’ axis measures the frequency of the output for each input, and uses a bar graph to chart them.
In the example diagram, it can be seen that 42% of the issues are related to installation, and that three of the categories; installation, software faults, and shipping, account for 79% of the issues.
[edit] Related articles on Designing Buildings
- Acceleration.
- Benchmarking.
- Contingency theory.
- Critical path method.
- Gantt chart.
- Key performance indicators.
- Line of balance (LOB).
- Milestones.
- Plan, Do, Check, Act (PDCA).
- Project crashing.
- Project manager.
- Project quality plan PQP.
- Quality in construction projects.
- Quality Management System.
- Resource leveling.
- Time-location chart.
- Time management.
- Value management.
- Work breakdown structure
[edit]
Featured articles and news

From Chaucer to Fawlty Towers.

Electrotechnical excellence, now open for entries.
Net zero electricity grids BSRIA guide NZG 5/2024

Outlining the changes needed to transition to net zero.
CIOB Global Student Challenge 2024

Universitas Indonesia wins for second year running.

New project and cultural district described in detail.
The nature of EPCs, crticism and inaccuracies.

History, issues and redesign.
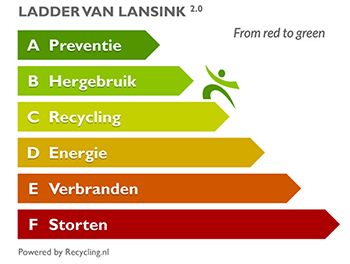
From waste recycling to energy performance the hierchy.
An introduction to WERCS and WEEE responsibilities

Dealing with 2 million tonnes of waste equipment a year.
Global BACS Market: analytics and optimisation

A BSRIA glance at building automation and control systems.

What it is and how to use it.

Types of insulating plaster by binder and insulant.
Investors in People: CIOB achieves gold

Reflecting a commitment to employees and members.

Scratching beneath the surface; a guide to selection.
ECA 2024 Apprentice of the Year Award

Entries open for submission until May 31.
UK gov apprenticeship funding from April 2024

Brief summary the policy paper updated in March.