Pareto analysis in construction
Pareto analysis is a statistical decision-making technique that identifies a limited number of input factors as having a greater impact on outcomes, whether they are positive or negative. It is based on the Pareto Principle, popularly known as the ‘80/20 rule’, that stipulates that 80% of the outputs result from 20% of the inputs.
The principle was developed by Vilfredo Pareto, a 19th century Italian economist and sociologist who was researching wealth distribution. He subsequently discovered the 80/20 rule applied to areas outside of economics, for example, 80% of the peas in his garden were produced by only 20% of the peapods planted.
Pareto analysis can also be used as a project management tool. For example, the majority of problems (80%) are produced by relatively few causes (20%); and 80% of the project’s benefits are delivered through 20% of the work.
Put simply, Pareto analysis shows that a disproportionate improvement can be made by ranking the various causes of a problem and allocating resources to tackling those that have the largest impact.
In construction, there may be a problem with the project programme that is the result of a large number of causes. Through observation and the collection of data, it might be determined that there are 8 causes. Pareto analysis may show that 80% of the problems result from the top 2 or 3 causes. The project management team can then plan an appropriate response, targeting resources at those 2 or 3 causes, rather than all 8.
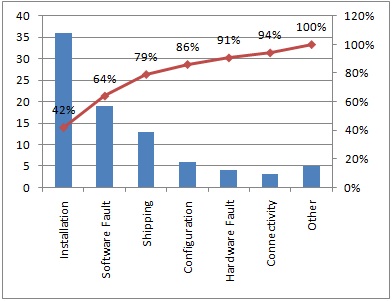
A Pareto diagram (or chart) can be used to present the analysis, helping the project team to focus on the inputs with the greatest impact.
Inputs are listed along the horizontal ‘y’ axis in descending order of output frequency (using the cumulative percentage of the outputs), and uses a line graph to chart them. The vertical ‘x’ axis measures the frequency of the output for each input, and uses a bar graph to chart them.
In the example diagram, it can be seen that 42% of the issues are related to installation, and that three of the categories; installation, software faults, and shipping, account for 79% of the issues.
[edit] Related articles on Designing Buildings
- Acceleration.
- Benchmarking.
- Contingency theory.
- Critical path method.
- Gantt chart.
- Key performance indicators.
- Line of balance (LOB).
- Milestones.
- Plan, Do, Check, Act (PDCA).
- Project crashing.
- Project manager.
- Project quality plan PQP.
- Quality in construction projects.
- Quality Management System.
- Resource leveling.
- Time-location chart.
- Time management.
- Value management.
- Work breakdown structure
[edit]
Featured articles and news
UKCW London to tackle sector’s most pressing issues
AI and skills development, ecology and the environment, policy and planning and more.
Managing building safety risks
Across an existing residential portfolio; a client's perspective.
ECA support for Gate Safe’s Safe School Gates Campaign.
Core construction skills explained
Preparing for a career in construction.
Retrofitting for resilience with the Leicester Resilience Hub
Community-serving facilities, enhanced as support and essential services for climate-related disruptions.
Some of the articles relating to water, here to browse. Any missing?
Recognisable Gothic characters, designed to dramatically spout water away from buildings.
A case study and a warning to would-be developers
Creating four dwellings... after half a century of doing this job, why, oh why, is it so difficult?
Reform of the fire engineering profession
Fire Engineers Advisory Panel: Authoritative Statement, reactions and next steps.
Restoration and renewal of the Palace of Westminster
A complex project of cultural significance from full decant to EMI, opportunities and a potential a way forward.
Apprenticeships and the responsibility we share
Perspectives from the CIOB President as National Apprentice Week comes to a close.
The first line of defence against rain, wind and snow.
Building Safety recap January, 2026
What we missed at the end of last year, and at the start of this...
National Apprenticeship Week 2026, 9-15 Feb
Shining a light on the positive impacts for businesses, their apprentices and the wider economy alike.
Applications and benefits of acoustic flooring
From commercial to retail.
From solid to sprung and ribbed to raised.
Strengthening industry collaboration in Hong Kong
Hong Kong Institute of Construction and The Chartered Institute of Building sign Memorandum of Understanding.
A detailed description from the experts at Cornish Lime.


