


Construction dissertation guide part 5 - Analysis and preparation of the results
This is part of a series of Construction Dissertation Guides for students. Click here for the whole series.

Once the data has been accumulated, the next stage is carry out analysis and present the results in a useful format.
Measurement is a procedure in which the researcher assigns numerals (numbers or other symbols) to empirical properties (variables). There are four principle levels of measurement and the primary data collection should use one or more of these.
Contents |
[edit] Nominal measurement
Nominal measurement consists of assigning items to groups or categories.
Nominal numbering implies belonging to a classification or having a particular property and a label. Since no quantitative information is expressed and there is no implied ordering of the items, nominal scales are qualitative in nature. The nominal scale is often used purely to provide an idea of quantities, for example:
- Number of lawyer-mediators from the sample = 15
- Number of construction lawyers from the sample = 6
- Number of respondents with 10+ years’ experience = 32
[edit] Ordinal measurement
Ordinal measurement is the ranking or rating of data which normally uses integers in ascending or descending order. The ordinal scale is most commonly used for calibrating the results of questionnaires that consist of attitudinal questions (that is, the recipient’s attitude towards a statement presented to them).
[edit] Alternative measurements
There are two alternative forms of measurement that can be used. The Interval Scale is used where the distance between each set of observations/data is constant, e.g. minutes, kilograms. This form of scale achieves best results when dealing with large numbers.
The Ratio Scale follows a similar concept; however, it involves a numerical scale which features a ‘natural zero’ such as age or distance.
[edit] Analysing the results
Once the data has been collected and sorted, the next stage is the analysis of those results. This is a means of determining the direction of the study and subsequently drawing conclusions in relation to the original hypothesis.
[edit] Descriptive statistics model
This can be used as a means of providing a general overview of the collected results. It is useful for questionnaire data providing results mostly in percentage or actual numerical form.
The three terms available for describing the aspects of group data are - frequency distribution, measurement of central tendency, and measurement of dispersion.
[edit] Frequency distribution
This is an assessment of the frequency of observations of each response to each variable under investigation in order to discern and display any distribution trend in the results. Results can be complex, but it is possible to represent them in a simplified way through tabulation, bar charts, pie charts or graphs.
[edit] Measures of central tendency
This is suitable where the most typical value is sought from a field of data. This can be achieved through using the mean, median and mode. The mean being the average of all the values in a set of data; the median being the value in the middle of the organised data; and the mode being the most frequently-occurring number in a set of values.
[edit] Measurement of dispersion based on the mean
This type of measurement displays the extent to which numerical information tends to be dispersed about an average value.
This can be represented by the Mean Deviation formula or, more commonly, the Standard Deviation formula:

This can be presented on a graph, where, typically, a ‘bell-like’ curve represents the data distribution.
[edit] Appraisal of the methodology
The methodology is the most important aspect of a research project, determining the overall success or failure of the study. A well-balanced collection of quality research and data is required in order to generate conclusions that may be reached and recommendations made. It is essential to carefully assess each aspect of the methodology and consider the risk of any errors that could have affected the reliability of the project as a whole.
Continue to next stage: Structuring and writing.
Featured articles
Check out some of the best features and news from Designing Buildings as well as key stories from around the web.

ECA welcomes plans to strengthen subcontractor quality control.

Combining mid-career qualifications with experience broadens career opportunities.
![]()
Why being a mentor can help your career.

Channel 4 broadcaster to host 125th anniversary ceremony.
Listed structures on the rail network
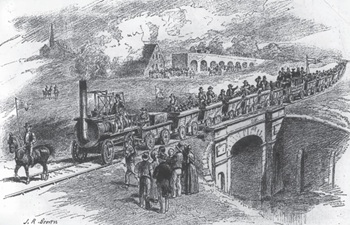
Heritage interests and operational requirements must be balanced.
Historic England publishes research into embodied carbon when retrofitting traditional buildings.

New Prime Minister delivers on ECA call for cut in electricity costs.

CIOB reacts to the announcement of Andy Burnham as Prime Minister.

Heritage and conservation science workforce survey - Have your say.

England's Suburbs 1820-2020. Book review.

New, more proportionate and targeted approach for higher-risk building assessments.

Government brings British Steel into public ownership.